| 1 |
|
3. ตัวช่วยให้ใช้ predictive model ง่ายขึ้น |
|
model predictions(ตัวจำลองในการคาดการณ์)
facilitator(เครื่องอำนวยความสะดวก)
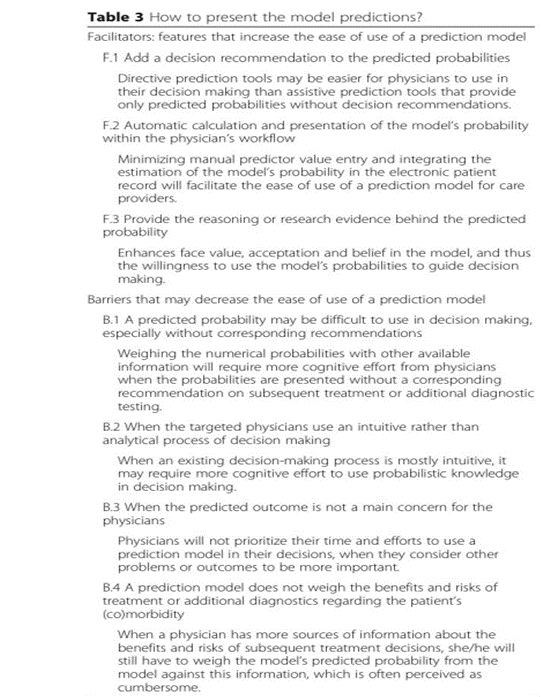
features that increase the ease of use of a prediction model
|
ในหัวข้อคือการนำเสนอ model predictions(ตัวจำลองในการคาดการณ์)
facilitator(เครื่องอำนวยความสะดวก) แต่ในตารางหมายถึง features that increase the ease of use of a prediction model
คือคุณลักษณะที่ช่วยเพิ่มความสะดวกในการ prediction model ซึ่งมี 3 ข้อ
|
7 |
-.50
-.25
+.25
เต็ม
0
-35%
+30%
+35%
|
| 2 |
|
4. Winter |
|
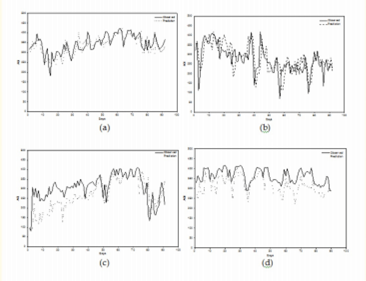
กราฟที่มีความเสียรมากที่สุด คือ กราฟที่ขึ้นสุดกับลงสุดตรงหรือใกล้เคียงกับจุดเดิม
|
กราฟ (a) Summer กับ กราฟ (b ) Monsoon มีความเสถียรสูงแต่ไม่เท่ากราฟ (d) Winter seasons
ส่วนกราฟ (c) Post Monsoon
|
7 |
-.50
-.25
+.25
เต็ม
0
-35%
+30%
+35%
|
| 3 |
|
4. ความเข้มข้นของมลพิษ |
|
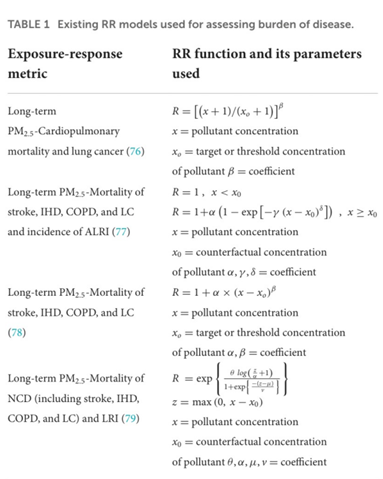
1.pollutant มาจาก pollution ซึ่งมีความหมายใกล้เคียงกัน ดังนั้นจึงมีความหมายเป็น มลพิษ
2.concentration จากการที่ทุกข้อมีคำว่าความเข้มข้นแสดงว่าคำนี้ต้องเป็นความเข้มข้น
3.ดังนั้น จึงตอบ pollutant concentration คือ ความเข้มข้นของมลพิษ
|
x = pollutant concentration
|
7 |
-.50
-.25
+.25
เต็ม
0
-35%
+30%
+35%
|
| 4 |
Number of tablets = Desired dosage / stock strength หากมี 7000 mg ของ Potassium carbonate และต้องการ 900 mg ต่อเม็ดจะได้กี่เม็ด
|
5. 7 |
|
7000/900 มีค่า ประมาณ 7.6
|
7000/900 มีค่า ประมาณ 7.6 ซึ่งได้ไม่ถึง 8 ดังนั้นจึงได้แค่ 7 เม็ด
|
7 |
-.50
-.25
+.25
เต็ม
0
-35%
+30%
+35%
|
| 5 |
ให้สั่งยา 9 mg/kg / dose โดยที่ Weight = 160 Ibs
|
2. 582 mg/dose |
|
9 mgdose/kg จะได้ 9mgdose/kgx72.57kg(160 lbs)= 653 mgdose
|
9 mgdose/kg จะได้ 9mgdose/kgx72.57kg(160 lbs)= 653 mgdose
|
7 |
-.50
-.25
+.25
เต็ม
0
-35%
+30%
+35%
|
| 6 |
ต้องการจัดยา 9 g of amoxicillin โดยมี amoxicillin 500 – mg capsules อยากทราบว่าต้องให้กี่ capsule
|
2. 18 |
|
mg คือ มิลลิกรัม
1 g = 1000 mg
9g = 9000 mg
|
9000 mg/500 mg = 18 เม็ด
|
7 |
-.50
-.25
+.25
เต็ม
0
-35%
+30%
+35%
|
| 7 |
ต้องการสั่งยา 0.8 mg SQ of ยา A โดยมี 4000 mcg/8 mL of ยา A
|
5. 0.8 mL |
|
|
|
7 |
-.50
-.25
+.25
เต็ม
0
-35%
+30%
+35%
|
| 8 |
หากเราค้นคว้าข้อมูลแล้วสามารถอธิบายสถิติตัวเลขที่จะเกิดขึ้นในอนาคตได้ ถือเป็น data analytics แบบใด
|
2. Predictive |
|
data analytics คือการวิเคราะห์ข้อมูล เมื่อได้ข้อที่วิเคราะห์มาแล้วจะได้ตัวเลขออกมาเป็นสถิติที่จะเกิดในอนาคตคือ การ prediction การคาดการณ์หรือพยากรณืที่เห็นในข่าวบ่อยๆ ซึ่งก็คือการ predictive
|
data analytics คือการวิเคราะห์ข้อมูล
predictive การคาดการณ์หรือพยากรณ์
|
7 |
-.50
-.25
+.25
เต็ม
0
-35%
+30%
+35%
|
| 9 |
จาก graph หาก A = 0.8 R =?
The infection attack rate is the total proportion of the population that is eventually infected during the epidemic, and it is denoted by A. This infection attack rate is completely determined by the reproduction number R and the contact process that describes who contacts whom. To illustrate the basic shape of the relation between the reproduction number R and the infection attack rate A. We suppose that infectious contacts are made at random
This provides us with a simple and robust relation that indicates what would happen if a new infection were to hit a completely susceptible population: if the
|
2. 2 |
|
เมื่อ A= 0.8 กราฟทางขวา R มีค่าเท่ากับ 2
|
เมื่อ A= 0.8 กราฟทางขวา R มีค่าเท่ากับ 2
|
7 |
-.50
-.25
+.25
เต็ม
0
-35%
+30%
+35%
|
| 10 |
จากข้อความ
Previous studies that applied the IER model in the analysis of ambient air pollution-related disease burden only focused on four specific diseases, which are IHD, stroke, COPD, and LC, because the development of the IER model relies to a great extent on the available RR information of these diseases, The IER model was increasingly used to estimate the attributable mortality using the result of calculated RR. Previous study has evaluated the global PM2.5 concentration-mortality relationships by using the IER model outputs. By applying the estimated relative risk (R), the premature mortality (M) for a specific disease outcome in a population is measured using Equation 3, with P and I indicating population and regional average annual disease mortality rate (also known as baseline mortality rate), respectively.
M = P x I x(1-( 1)/R)
M คือค่าอะไร
|
3. อัตราการตาย |
|
the premature mortality
mortality(ตาย)
|
the premature mortality
mortality(ตาย)
|
7 |
-.50
-.25
+.25
เต็ม
0
-35%
+30%
+35%
|
| 11 |
ข้อใดเกี่ยวข้องกับ Calculus ในการผ่าตัดจากบทความ
|
1. volume of red blood |
|
|
|
7 |
-.50
-.25
+.25
เต็ม
0
-35%
+30%
+35%
|
| 12 |
Math model และ Physical therapy ไม่มีความเกี่ยวข้องกันอย่างไร
|
5. ถูกมากกว่า 1 ข้อ |
|
ในข้อ 3. concussion การชน
4. motion การเคลื่อนไหว
|
concussion การชน
motion การเคลื่อนไหว
|
7 |
-.50
-.25
+.25
เต็ม
0
-35%
+30%
+35%
|
| 13 |
ข้อใดเกี่ยวข้องกับบทความ Epidemiology Figure 1
|
2. In the next four decades, cancer deaths are expected to overcome those for ischemic heart disease, with a 2.08-fold increase (1.76-fold for increase in ischemic heart disease) by the year 2060. |
|
|
|
7 |
-.50
-.25
+.25
เต็ม
0
-35%
+30%
+35%
|
| 14 |
ข้อใดเกี่ยวข้องกับ math model ที่จะมีประโยชน์กับกายภาพบำบัดของผู้ป่วย stroke
|
5. ถูกมากกว่า 1 ข้อ |
|
|
|
7 |
-.50
-.25
+.25
เต็ม
0
-35%
+30%
+35%
|
| 15 |
ข้อใดเกี่ยวข้องกับ math model กับ drug diffusion through the blood
|
3. basis of the drug efficacy |
|
|
|
7 |
-.50
-.25
+.25
เต็ม
0
-35%
+30%
+35%
|
| 16 |
ข้อใดจาก Noyers whiter equation the rate of dissolution of a solid is dependent on?
|
2. the concentration of solute in solution at a particular time |
|
|
|
7 |
-.50
-.25
+.25
เต็ม
0
-35%
+30%
+35%
|
| 17 |
ข้อใดเกี่ยวข้องกับ math model กับ tissue reconstruction
|
3. macro architectures |
|
|
|
7 |
-.50
-.25
+.25
เต็ม
0
-35%
+30%
+35%
|
| 18 |
ข้อใดมี approximating 100% survival at 5 years,
|
2. Breast cancer |
|
|
|
7 |
-.50
-.25
+.25
เต็ม
0
-35%
+30%
+35%
|
| 19 |
ข้อใดเกี่ยวข้องกับ Math model กับ patient diagnosis
|
4. the patient's data vector |
|
|
|
7 |
-.50
-.25
+.25
เต็ม
0
-35%
+30%
+35%
|
| 20 |
ข้อใดเกี่ยวข้องกับ Math model ที่ใช้ในการวิเคราะห์ข้อมูลทางการแพทย์
|
1. the Kaplan–Meier curve. |
|
|
|
7 |
-.50
-.25
+.25
เต็ม
0
-35%
+30%
+35%
|